Who Can Live in Chicago? Part II: Age
Our last blog post mapped out the change in spatial distribution of income between 1970-2016 and found three distinct “cities” within the City of Chicago:
- City One includes all Census Tracts that increased their proportion of regional income by 20 percent (622,099 people);
- City Two includes all Census Tracts that increased or decreased their proportion of regional income by less than 20 percent (770,277 people); and
- City Three includes all Census Tracts that decreased their proportion of regional income by 20 percent (1,344,751 people);
As we illustrated, Chicago is growing more segregated by income over time. And it appears, so too by age. For instance, of the more than 673,000 people 19 years or younger, 59% live in City Three.
Young People Heading link
Most young people in Chicago live in lower income communities of color.
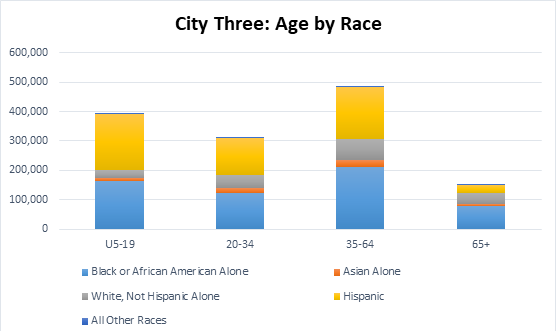
City Three is predominantly non-white and young, with the largest population of individuals (394,175) under the age of 20. This accounts for nearly 60% of all young people in Chicago. When broken out by race/ethnicity, 48% of these young people are Latino and 41% are Black. In contrast, only 7% are White and 3% Asian.
City One Heading link
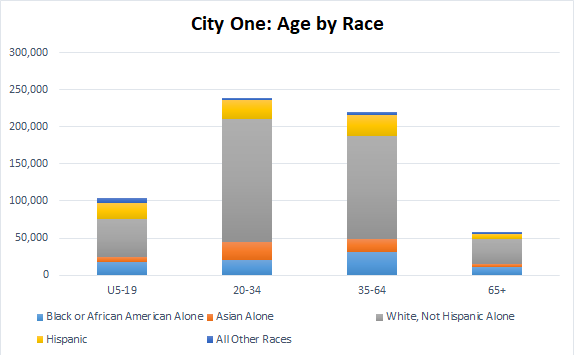
By comparison, City One is home to nearly 104,000 people under the age of 20 – about a fourth of the number of young people in City Three. In stark dissimilitude to City Three, 50% are White, while only 17% are Black and 20% Latino.
Older People Heading link
Most older people in Chicago live in lower income communities of color.
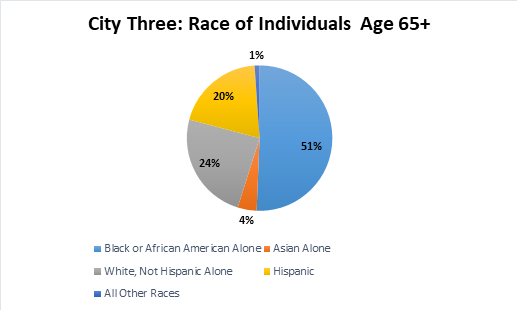
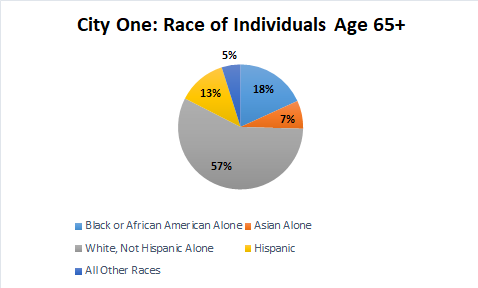
Just as young people are concentrated in City Three, so too are older people. In Chicago, nearly half of individuals 65 and over live in City Three. Of this group, 51% are Black, 24% are White, and 20% are Latino. City One, again, is very different with only 19 percent of Chicago’s population individuals 65 and over. Of these individuals, 57% are White, 18% are Black, 13% are Latino, and 7% are Asian.
City Three Heading link
In sum, City Three is by and large home to a lot of young people and a large aging adult population, while City One has only a small fraction of each. What City One does have is a predominance of White and Asian millennials. Of all millennials in City One, 70% are White. Furthermore, over a quarter of City One’s entire population is White and between the ages of 20-34, comprising the largest age and racial cohort in all of City One. Finally, of all Asians living in City One, nearly half are millennials.
These data raise several policy questions, including the distribution of educational resources across Chicago.
For example, how do age disparities throughout the City affect access to education? Previous research has shown a correlation between rapidly rising home prices and school closures due to under-enrollment.
Additionally, how does the geographic investment in school infrastructure in Chicago align with where young people predominantly live? A recent WBEZ report shows disproportionate spending on school infrastructure in City One when compared to City Three, while another report shows a backlog of investment in City Three.
Stay tuned for our next blog, where we will take a look at housing cost burden across our three cities.