Transformed? Public Housing in Chicago 2000-2015
The Chicago Housing Authority (CHA) launched its Plan for Transformation (pdf) (PFT) in 2000. This included demolishing and replacing most of the large family projects on Chicago’s south and west sides with lower density, mixed income communities.
The PFT, initially a 10-year plan focused on redeveloping 25,000 units, is still working towards this goal after 15 years. According to the 2015 data from the US Department of Housing and Urban Development (HUD), 21,285 public housing units have been completed and 17,673 are occupied. According to the CHA, there are ten new projects in the pipeline.
As the CHA moves forward, a new ordinance is being considered. The City of Chicago Keeping the Promise Ordinance aims to “strengthen City Council oversight of the Chicago Housing Authority (CHA) in order to maximize the impact of the public resources under the CHA’s stewardship and to increase housing options for low-income households in opportunity communities.” Seeking to better coordinate city planning efforts and resources, the ordinance aims to help to increase the housing choices available to low-income residents including those residing in public housing.
The goal of bringing more affordable public housing options to opportunity communities raises a question: how has opportunity changed in the communities where public housing is located now compared to when the PFT was initiated? To answer this question, we looked at poverty levels in the census tracts where public housing was located in 2000 and 2015. This includes new mixed-income family developments, rehabilitated senior only (55 years and older) buildings, and scattered-site units.
Poverty Concentration
Poverty levels provide an important way to look at opportunity. Critics of traditional public housing have pointed to its tendency to concentrate poverty in one development or neighborhood as a major design flaw. One of the rationales for mixed-income housing is that it helps to ensure that low-income residents in these neighborhoods will have more opportunity than residents living in high concentrations of poverty. Following this logic, transforming public housing would reduce the number of public housing units in high poverty areas. However, income mixing also can be achieved by maintaining or even increasing public housing units in lower poverty areas such as the neighborhoods where Cabrini Green and Lathrop Homes are located, where the number of permanent public housing units has been reduced.
In 2000, a family of four was considered in poverty when its income was below $ 17,463. In 2015 that threshold was $24,250. In 2000, the year the PFT was approved, Chicago’s poverty rate was 20% – so 1 out of 5 households was in poverty. Currently it is higher at 23% (nearly 1 out of 4). Table 1 shows the distribution of units by census tract poverty level based on data collected by HUD from the CHA. Using the threshold for poverty in each year, we compared the two time periods by multiplying the city poverty rate by the values in the left column. We then counted the number of units in each poverty category.
Table 1. Public Housing Units in Chicago distributed by Census Tract Poverty Rate, 2000 and 2015 Heading link
| 2000 (poverty rate = 20%) | 2015 (poverty rate = 23%) | |||
|---|---|---|---|---|
| Poverty Level | Total Units | Occupied Units | Total Units | Occupied Units |
| At or below poverty level | 6,363 (17%) | 4,490 (19%) | 5,693 (27%) | 4,728 (27%) |
| 1.01-1.50 x poverty rate | 6,889 (19%) | 5,113 (21%) | 6, 032 (28%) | 5,007 (28%) |
| 1.51 -2.0 x poverty rate | 3,772 (10%) | 2,634 (11%) | 5,242 (25%) | 4,352 (25%) |
| More than 2x poverty rate | 19,860 (54%) | 11,825 (49%) | 4,318 (20%) | 3,586 (20%) |
| Total Units | 36,884 | 24,062 | 21,285 | 17,673 |
Public Housing in Chicago 2000-2015 Heading link
Source: US HUD, A Picture of Subsidized Households, 2000 and 2015
Based on a review of the data:
- The largest change has been the decrease in the number and proportion of public housing units in tracts that are more than twice the poverty rate (tracts with more than 40% of the households in poverty in 2000 and more than 46% in 2015).
- There are fewer units now in tracts that are at or below poverty (5,693 units) than before the PFT (6,363 units).
- There are more units in tracts that are 1.5-2.0 times the poverty rate (5,242 units) than in 2000 (3,772 units).
One interpretation of this data is that we are seeing opportunity “constrained.” While the amount of public housing in high poverty tracts has declined significantly (a positive outcome), the number of units in below poverty tracts has not increased. This constraint is more pronounced when using the same poverty rate in 2015 as in 2000 (20%), with even fewer units in below poverty census tracts overall (see Table 2).
Table 2. Public Housing Units in Chicago distributed by Census Tract Poverty Rate, 2000 and 2015 (at 2000 Poverty Rate) Heading link
| 2000 (poverty rate = 20%) | 2015 (2000 poverty rate = 20%) | |||
|---|---|---|---|---|
| Poverty Level | TOTAL | OCCUPIED | TOTAL | OCCUPIED |
| At or below poverty rate | 6,363 (17%) | 4,490 (19%) | 3,352 (16%) | 2,783 (16%) |
| 1.01-1.50 x poverty rate | 6,889 (19%) | 5,113 (21%) | 5,599 (26%) | 4,650 (26%) |
| 1.51-2.0 x poverty rate | 3,772 (10%) | 2,634 (11%) | 6,360 (30%) | 5,279 (30%) |
| More than 2x poverty rate | 19,860 (54%) | 11,825 (49%) | 5, 974 (28%) | 4,961 (28%) |
| Total Units | 36,884 | 24,062 | 21,285 | 17,673 |
Table Citation Heading link
Source: US HUD, A Picture of Subsidized Households, 2000 and 2015
Development Opportunity Heading link
These data raise a second question: Moving forward, how might the CHA complete its plan in ways that increase opportunity?
Development Opportunity
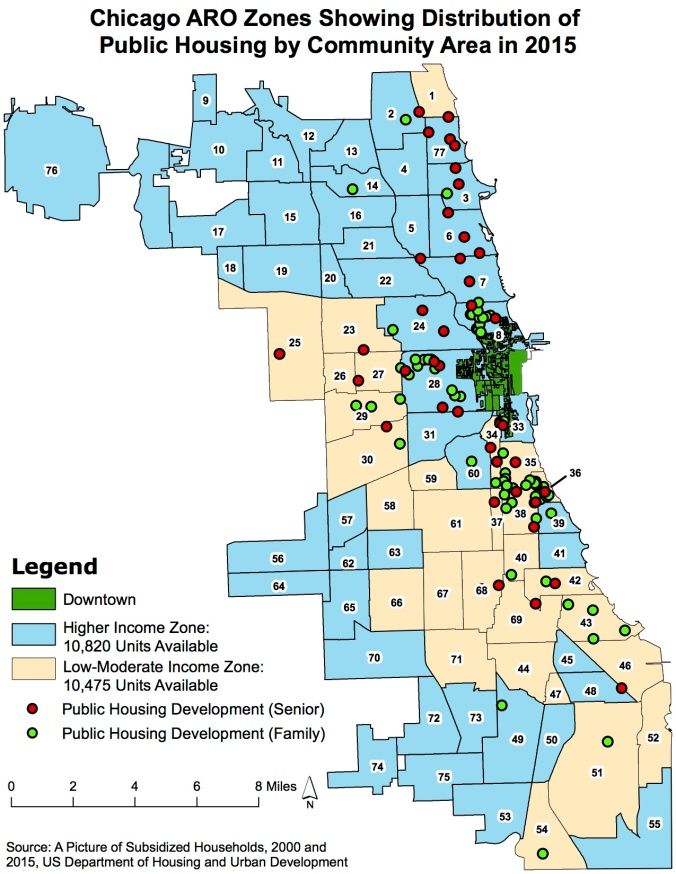
In 2015, the City of Chicago updated the Affordable Requirements Ordinance (ARO), which includes a new zone map that divides the city into one of three zones: 1) downtown; 2) higher-income areas; and 3) low-moderate income areas. When we map out the distribution of public housing units across the 77 community areas relative to their ARO classification, we find an interesting pattern (see Map 1). Using this framework, we find that 10,820 public housing units are located in higher income communities – those where at least half of the households earn more than 60% of the Chicago median income and the poverty rate is less than or equal to 25%. This includes hundreds of public housing units in the still redeveloping Cabrini Green on the near north side, where a developer of a new luxury rental building still under construction just announced its 2-bedroom units will rent for $3,200 a month. The building will have 10 percent of its 240 units available for tenants with vouchers and another ten percent will be affordable to families with incomes up to 60% of Area Median Income.