Chicago by the Numbers: What We Know from the Latest American Community Survey
On September 17th, the US Census Bureau released results from the latest American Community Survey (ACS). The ACS is an ongoing annual survey administered by the US Census Bureau that provides vital information about the nation’s population and its characteristics. Here are the survey results for Chicago on several key data points, with a look at trends over the past five years:
Modest Population Growth Heading link
Modest Population Growth
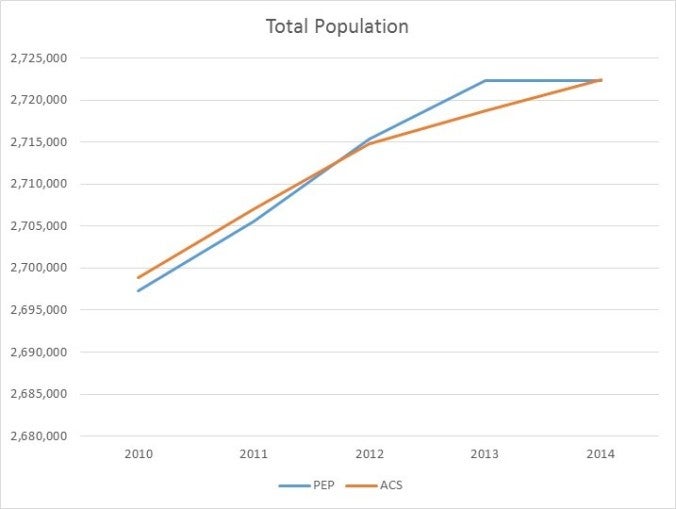
The 2014 ACS estimates Chicago’s population to be 2,722,407 (+/- 79), which is an approximate 3,618 increase over last year’s figure of 2,718,789 (+/- 52). While the ACS produces population estimates, the official estimates of total population for the nation, states, counties, cities, and towns is produced by the Census Bureau’s Population Estimates Program (PEP). The PEP uses data on births, deaths, and migration to construct time series figures for each year between the decennial censuses. The latest PEP figure for Chicago in 2014 is 2,722,389, which is similar to the ACS estimate. With either estimate, Chicago saw an approximate 1% growth from 2010, which outpaces growth for Illinois as a whole (.3%), but is less than the national increase of 3.1%.
Racial & Ethnic Composition- Loss of Blacks, Gains in Latinos Heading link
Racial & Ethnic Composition- Loss of Blacks, Gains in Latinos
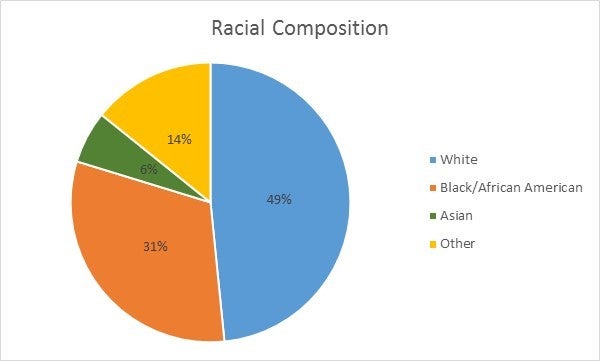
According to the 2014 ACS, 49% percent of Chicagoans identity as White, 31% as Black/African American, 6% Asian, and 14% some other race including persons of more than one race. 30% of the city is Hispanic/Latino (of any race).
Racial and Ethnic Composition Heading link
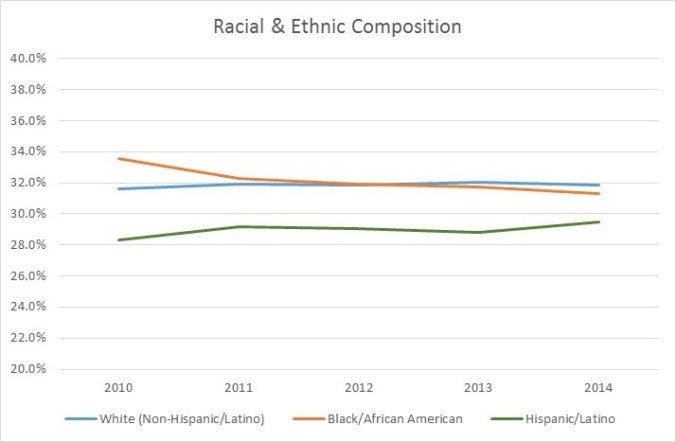
The city has seen some minor shifts in its racial and ethnic composition. An examination of ACS data from the last five years shows that the proportion of Blacks/African Americans has decreased slightly. Hispanics/Latinos have increased while the proportion of non-Hispanic/Latino Whites remained unchanged. It is difficult to determine where Chicago’s Black population is relocating. Growth in the number of Black households in surrounding counties suggests some households may be relocating from the city to neighboring suburban areas.
Age Composition- Fewer Children, More Seniors Heading link
Age Composition- Fewer Children, More Seniors
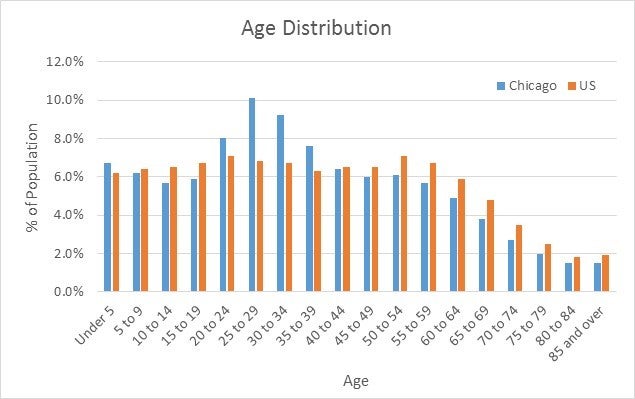
Similar to figures in past years, Chicago outpaces the nation in its number of young adults age 20 to 40 and lags in its number of Baby Boomers (age 50 to 70). Concurrent with nationwide trends, Chicago saw a slight dip in the proportion of children (under age 20) over the past five years. Similarly, seniors also grew in number, but figures remain below the national average.
Household Income & Poverty Rate- Post Recession Recovery Heading link
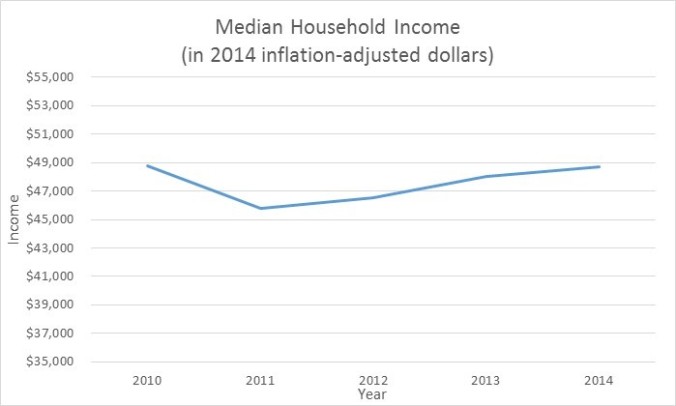
Household Income & Poverty Rate- Post Recession Recovery
After dipping in the wake of the recession, median household income for Chicago increased for the third consecutive year when adjusting for inflation and have roughly rebounded to 2009 levels.
Poverty Line Heading link
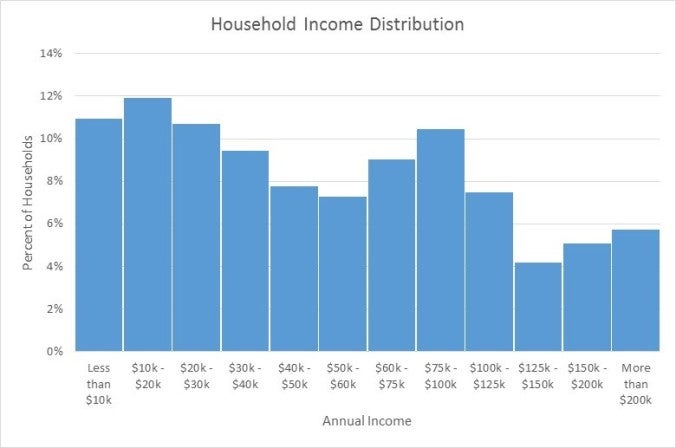
Eleven percent of Chicago households earn less than $10,000 a year, with 23% earning less than $20,000 annually. Twenty-two percent of households earn over $100,000.
Twenty-two percent of Chicagoans live below the poverty line, which was $24,817 for a family of four. This figure is down slightly from 2012’s figure of 23.9% at the height of the Recession.
Gini Coefficient- Higher than the nation, Similar to Like-Sized Cities Heading link
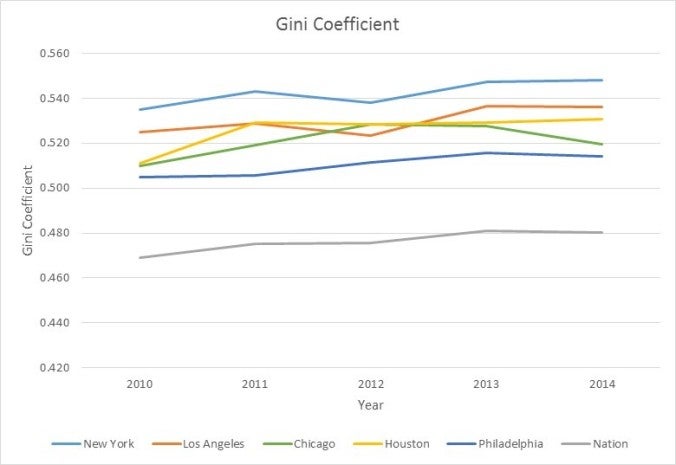
Gini Coefficient- Higher than the nation, Similar to Like-Sized Cities
Chicago’s Gini Coefficient remained above the national average but comparable to other cities its size. The Gini coefficient (or Gini index) is a commonly used index of wealth concentration. The closer a country or city’s coefficient is to 0, the more equally distributed its income. The closer the Gini coefficient is to 1, the more unequal its income distribution. Of the five largest cities, New York’s coefficient remained the highest while Philadelphia trailed Chicago by a small margin. For more information on how Chicago’s Gini Coefficient has changed over the past four decades, see our previous post A Deepening Divide: Income Inequality Grows Spatially in Chicago.