A Deepening Divide: Income Inequality Grows Spatially in Chicago
A recent study completed by the Brookings Institution ranks Chicago 8th in income inequality among the nation’s largest cities. Yet, there is more to Chicago’s inequality story. Research completed by The Voorhees Center at the University of Illinois at Chicago in partnership with Cities Centre at the University of Toronto reveals that not only has inequality in Chicago been growing over the last 40 years, it also exhibits strong spatial patterns. Chicago is now a highly-polarized city absent of middle class households that in 1970 made up nearly half the city. By 2010, the number of wealthy census tracts had increased nearly four-fold with a visible concentration on Chicago’s North Side, while tracts that are very low-income and with high rates of poverty expanded on the South and far West sides.
Understanding Change: The “Three Cities” Methodology
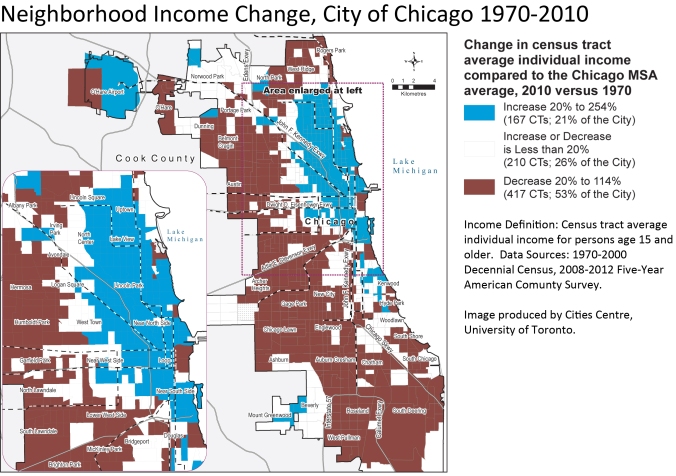
Using methodology developed by the University of Toronto’s Cities Centre, Census tracts in Chicago were classified into one of three categories based on income change from 1970 to 2010. These categories tell a story of three distinct ‘cities’ within a city, each with different experiences over the past forty years. “City #1” (indicated in blue on the map below) is a predominately high-income area of Chicago where incomes have risen relative to the region’s average. In 2010, City #1 is concentrated largely on the North and near West sides. By contrast, City #3 (indicated in red) represents largely low-income areas of Chicago, where neighborhood incomes have fallen over the past few decades compared to the regional average. City #3 comprises much of Chicago’s South and far West sides. In between City #1 and City #3 is City #2, where incomes have remained fairly similar to the regional average since 1970. These City #2 areas (indicated below in white) are sandwiched between City #1 and City #3, with small concentrations in the far northwest and southwest corners.
City of Chicago Average Individual Income Heading link
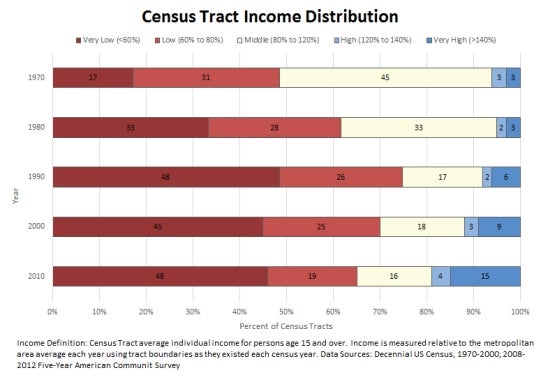
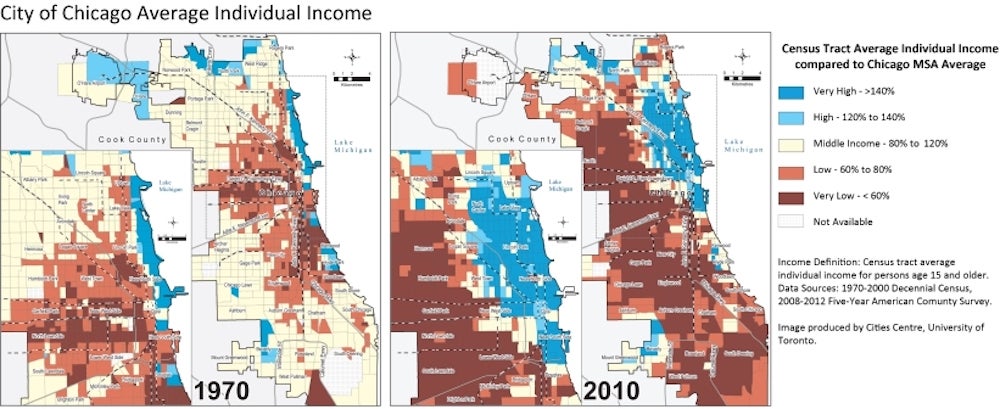
In 1970, the majority (46%) of Census tracts in Chicago were middle-income, meaning their average individual income fell within 80% to 120% of the regional average. Very high income tracts (over 140% of regional average income) comprised only 4% of the city, while very low income tracts (those with individual incomes averaging 60% or less of the regional average) comprised 17% of the city. By 2010, middle income tracts shrunk to only 16% of the city. Very high income tracts grew to 15% and very low income tracts swelled to almost half (46%) of the city. Chicago’s high-income residents are increasingly concentrated on the city’s North side, while large swaths of the South and far West sides house most of Chicago’s low-income residents.
Growth in Chicago’s Gini Coefficient Heading link
Growth in Chicago’s Gini Coefficient
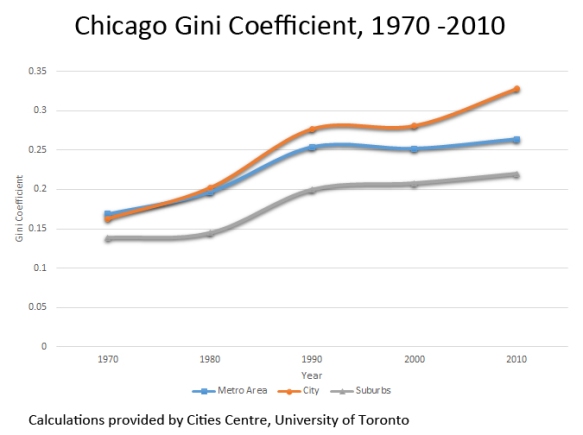
In addition to spatial patterns of wealth and poverty, Chicago’s wealth has become more concentrated. The Gini coefficient (or Gini index) is a commonly used index of wealth concentration. The closer a country or city’s coefficient is to 0, the more equally distributed its income. The closer the Gini coefficient to 1, the more unequal its income distribution. In Chicago, Gini coefficients increased across the board for the city, its suburbs, and the metropolitan area as a whole since 1970, reflecting growing income inequality throughout the region. Figures for the city of Chicago more than doubled, increasing from 0.163 in 1970 to 0.328 by 2010. (Note that the Gini Coefficient for the US in 2010 was .411 according to the World Bank). The greatest jumps in coefficient values occurred from 1980 to 1990 for all geographies, and from 2000 to 2010 for the city of Chicago.
Why does this matter? Heading link
Why does this matter?
It has long been held that a ‘healthy’ level of inequality is needed to encourage growth and progress. But how much inequality is too much? Various academics and policy researchers including former Secretary of Labor Robert Reich and economist Thomas Piketty have triggered debates about whether the U.S. has become too unequal. A recent study from the Organisation for Economic Co-operation and Development (OECD) suggests that growing income inequality may be dampening rather than helping growth, particularly when income inequality is associated with unequal educational opportunities. Inequality has figured prominently into recent public discourse. President Obama has declared it “the defining challenge of our time,” and mayors such as New York’s Bill de Blasio have addressed the theme in successful campaigns. As trends continue, leaders and policy makers will have to increasingly consider what growing inequality means not only for individual and family well-being, but for the health of cities, communities, and the nation as a whole.